Saturday, September 15, 2012

Using Unity for Dependency Injection With WCF Services

The Dependency Injection (DI) pattern of software development offers many benefits in the area of separation of concerns.  The loose-coupling nature of this pattern allows for truly atomic unit tests and (theoretically) more effective development.    

While the DI pattern is well documented in web UI technologies that espouse separation of concerns (such as MVC), the use of this pattern in the less glamorous area of application integration using web services is a little leaner on the volume of documentation.  Being that application integration apps such as WCF Services have a tendency to perform some elaborate transportation and transformation logic, having the benefits of the DI pattern greatly improves the effectiveness of the development of these applications.

So, in terms of WCF Services, how exactly do we achieve the DI pattern?  Thanks to the lightweight Unity library, we can offer the following DI benefits for a WCF Service:

  • File-less activation of services (no more pesky .svc files to maintain)
  • Loosely coupled development
  • Rapid and agile development thanks to unit testing
Coding commences after the jump!

Sunday, June 17, 2012

Business Intelligence Shootout: Microsoft SQL Server 2008 BI vs. Pentaho BI Enterprise Edition (Part 2: SQL Server Analysis Services)

The BI Platform That They Already Own
So, now that we've seen some of the basic capabilities of Pentaho Analysis Services (aka Mondrian), let's check the other side of the ring where SQL Server Analysis Services (SSAS) sits.  The entire SQL Server BI stack is a very interesting case.  Starting with SQL Server 2005, Microsoft began packaging their entire BI suite with a Standard Edition license, and I mean the whole shebang.  SSIS, SSAS, SSRS, SSMS, and BIDS...the whole gang to satisfy all data analytic needs.  Apparently, this was not emphasized enough in the literature for Microsoft SQL Server, because more often than not, this can be news to IT folks in enterprises.  Usually, it's good news, as the company may have already made a sizeable investment in SQL Server, and the icing on the cake is a world-class BI platform.

Now, for those companies who haven't already made an investment in SQL Server, the barrier to entry for SQL Server BI may be the price of a license.  After all, the bulk of the license fee pays for the RDBMS, one would argue.  However, this does not diminish the value of the SQL Server BI stack.  This platform has come a long way since Analysis Services was first revealed in SQL Server 2000, and we will take a deep dive into the capabilities of the latest features within SQL Server 2008 R2 Business Intelligence.

Monday, February 20, 2012

Business Intelligence Shootout: Microsoft SQL Server 2008 BI vs. Pentaho BI Enterprise Edition (Part 1: Pentaho Analysis Services)

A Tale of Two Analytic Engines
In this first head-to-head comparison, we pit Microsoft SQL Server Analysis Services (SSAS) 2008 against Pentaho BI's Analysis Services.  As mentioned in the introductory post, in-memory analytic engines aren't exactly new hat.  In fact, the inspiration for these engines came from very simple spreadsheet applications, hence the origins of Essbase's name -- "Extended Spread Sheet Database."  Despite their age, the benefits of analytic engines remain the same: data retrieval and ad-hoc analysis at lightning speeds.  Because most of the data is persisted in RAM, the speed at which you retrieve the data is only limited by your network speed and your user interface's rendering.  With that in mind, we have two analytic engines here that drew inspiration from similar roots, but go about their implementations differently.  

Microsoft SQL Server Analysis Services has actually been around since SQL Server 7, thanks to Big Redmond's acquisition of Panorama Software.  It has only been a recent development, starting with SQL Server 2005, that Microsoft has made a serious push into the BI space, literally offering its entire BI stack for free with a SQL Server 2005 (and then later, 2008) Standard Edition license.  Microsoft innovated the now ubiquitous Multi-Dimension Expression (MDX) query, and has made strides in usability, deeply integrating the SQL Server BI platform to all of its core enterprise offerings, Microsoft Office and Microsoft Sharepoint, as well as its well renowned integrated development environment, Visual Studio.

Pentaho Analysis Services, aka Mondrian in the open source world, is a relative newcomer to the BI marketplace.  Started by industry veterans from the defunct Arbor Software (where Essbase was incubated and released) at the turn of the 21st century, this Java-based analytic platform began its roots as an open source platform, along with the other components of Pentaho BI.  The goal of its founders was to create a powerful, flexible, cohesive, scalable, and cost-effective platform, meeting or exceeding the capabilities of its commercial conglomerate counterparts.  Who better to architect and develop such a solution but some of the very pioneers of the BI movement?  PAS is the core of the Pentaho BI stack, offering seemingly the same capabilities as other analytic engines in the market.


With the history of both analytic engines in mind, let's take a deep dive at both, using AdventureWorks as the star schema base.  For the impatient, I have published all the artifacts produced in this blog post on my source control system, which grants everyone read access.  If you have a Subversion client, point to https://edg.sourcerepo.com/edg/PentahoAdventureWorks


Friday, February 3, 2012

Business Intelligence Shootout: Microsoft SQL Server 2008 BI vs. Pentaho BI Enterprise Edition (Introduction)

Business Intelligence: A History in Review
Business Intelligence (BI) has become a hot topic in IT and business in recent years.  In the past, BI seemed more like a gimmick, with disconnected pieces of software made by various purveyors that seemingly required a significant upfront investment from both IT and business resources, from both a fiscal and training standpoint.


You might have a tremendous analytic engine from someone the likes of Arbor Software with their Essbase platform, but to effectively syphon the data out into a presentable, maintainable format, you'd also have to invest in some sort of enterprise reporting tool like Arcplan.  Furthermore, to grant users the ability to perform ad-hoc slice and dice analysis, you'd need an analytic software package pushed by a company like Hyperion.  The overall experience of BI, much like its roots, seemed disjointed, with no common vision, and as a result, was expensive to learn and maintain and did not impact the business world the way it had hoped.


The days of disjointed BI have thankfully past, and we are in an era of computing where these tools have become nearly as slick as their web and desktop enterprise application counterparts.  Speed of deployment, ease of use, and cost efficiency are the key elements in modern BI.  Users want their data faster, more flexible, and robust enough to truly gain that holy grail of turning business intelligence into business INSIGHT. 


The Geekstantialism BI Shootout!
In this eight-part series, we will bring two up-and-coming BI platforms front and center, and objectively review the strengths and weaknesses of each, as well as make some recommendations on their optimal effectiveness.


In one corner stands a slick platform backed by the billions of the Microsoft Corporation -- SQL Server 2008 BI.


In the other corner, a young upstart Java-based open source BI platform architected by some of the brightest minds in BI since its inception -- Pentaho Business Analytics.


The Parameters
In order to gain the best insight of the strengths and weaknesses of both platforms when stacked up against each other, I've put together the following parameters/requirements that both must follow in this thought exercise...

Pentaho System Setup
  • Ubuntu Linux Server 11.10
  • Apache Tomcat Server
  • MySQL database backend
SQL Server 2008 Setup
  • Windows Server 2008 Enterprise Edition
  • IIS
  • SQL Server 2008 backend

Data Source
The base data warehouse for both will be the AdventureWorksDW2008 database offered by Microsoft.  Obviously, as Pentaho BI runs off of MySQL out of the box, I will be converting said SQL Server database to MySQL, keeping it structurally the same.


Analytic Engine
Using the design tools for both platforms, cubes will be built against all fact tables in the AdventureWorksDW2008 database.  All dimensions will be created.  Dimensional hierarchies will be created where applicable.  Simple calculated members will be created.  Data mining options will be briefly evaluated.


Ad-hoc Analysis
The following ad-hoc slice, dice, and drillthrough will be performed against both platforms using the respective front-ends:

  1. Investigation of Internet Sales by Product, Customer, and Sales Territory
  2. Investigation of Reseller Sales by Order Date, Employee, and Promotion
Reporting
Both platforms will be evaluated in producing the following reports using provided design tools and persisting them to their respective report servers for distribution:
  1. Call Center Report by Date Shift
  2. Category of Items Purchased by Customer and Date.
Integration Engine
Both integration engines will be evaluated by using the design tools provided and will perform the following:
  1. Refresh DimProduct with new data (CSV source)
  2. Refresh DimCustomer with new data (CSV source)
  3. Rebuild the respective cubes and dimensions on the respective platform
The Final Verdict
After going through the components of both BI platforms, I will outline the overall strengths and weaknesses of both, and make some educated recommendations on the optimal implementation of either platform.  The goal here isn't necessarily to determine which is truly "better" (as that can be a relative term, depending on the circumstances), but instead to gain a better understanding of what scenarios would call for what tool.  After all, that's the whole fun in technology!


My Qualifications
Finally, if you haven't done so already, you must be asking yourself what makes me qualified to make any sort of judgement call on BI platforms?  Professionally, business intelligence has been my specialty area for the past 6 years.  Having been involved as the lead developer for multiple BI platforms on projects of varying sizes in finance and investments, I have practical experience on BI implementations and the demands of its users.


I do have a depth of knowledge with the Microsoft product stack, as that has also been my professional specialty for about 9 years now (specifically Visual Studio [C#, VB, ASP .Net], SQL Server, and the SQL Server BI stack).


I also have a depth of knowledge in the open source and Java, always experimenting with various flavors of Linux (from RedHat to Mandrake to Debian and now Ubuntu).  For fun, I like to develop Google Android apps.  


This will be my first deep dive into the Pentaho platform.  I hope to gain and document insight into this well-regarded platform and see how it stacks up to the SQL Server BI stack that I know well.  Furthermore, I've always had a soft spot for open source initiatives, but found many times that they're a little too rough around the edges for risk-averse enterprises.  Pentaho looks a bit more promising.


Pentaho claims to be able to lure people away from "big commercial BI" with its platform, and I want to put that to the test.  Is it really a BI platform I can confidently recommend as a viable, and even superior, option when scoping out projects?  Time will tell, and I'm excited to find out!   


Stay tuned for Part 1: Pentaho Analysis Services!

Thursday, January 19, 2012

Sebastien Lorien's Fast CSV Reader: Standing the Test of Time

A couple of years ago, when I was working on some data integration projects and didn't have the luxury of SSIS or Informatica, I had to write some custom .Net components to handle CSV sources flowing into OLEDB destinations.  Thinking about what libraries are available in standard .Net (2.0 at the time) -- String parsers, RegEx handlers, StreamReaders, etc. -- one would think it would relatively be a cinch.  However, I wanted to have some of the niceties afforded to ETL engines like SSIS and Informatica.  Specifically, fully qualified text fields, handling of escaped characters, custom delimeter characters, and missing field actions.


Instead of trying to reinvent the wheel, I scoured CodeProject for some inspiration as a starting point.  Never did I realize that an entire CSV parsing library was written so well, that I ended up using the entire project out of the box for my CSV handling needs.  This is the case with Sebastien Lorien's Fast CSV Reader.


Sebastien did a tremendous job in parsing CSV's the way a good integration utility (such as SSIS or Informatica) would.  You name it, this library's got it: handling missing required fields, handling malformed CSV rows, field headers, the works.  I believe the only thing that it didn't do (at the time I used it) was identifying exactly which field was not in an expected data format.  That may have changed over the years, however, so I'll have to bring it into a test project and see what she can do now, about 3 years later.


Oh, and one other thing.  The Fast CSV Reader is incredibly memory efficient.  I can corroborate the numbers reported on the Code Project site for this code, she runs lean and mean.  I seem to recall running a relatively large CSV file (several hundred megabytes) using the reader, and it ran quickly and I didn't have any memory issues.  For that, if I ever meet Sebastien in real life, I would definitely give him a Geek High Five.


Anyway, it appears that this project is still actively supported by Sebastien, so if you are writing custom .Net utilities to handle CSV's (or any character delimited file), I'd highly recommend either using Fast CSV Reader or using its code as a starting point for your implementation.

Saturday, January 14, 2012

Google Chrome: What's With All those Processes?

Full disclosure: I love Google Chrome.  Ever since its release, I have not used another browser, be it my old beloved Firefox, Opera, and Internet Explorer.  However, one thing always kind of piqued my curiosity about my fast, relatively lightweight browsing friend, Chrome: why the heck does it fire off x processes (10 on this particular instance) of Chrome.exe at launch?

Hmm...Google Chrome phone home while I'm not looking, perhaps?
Upon some further digging, you can check out what's going on behind the scenes with Chrome by clicking on Tools --> View background pages


And this little window pops up...


Ah-ha...there is the answer to our question.  In this example, I had 10 processes of Chrome.exe fire off...to correspond with my extensions AND the tabs I currently have open in Chrome.

So, in case you were ever nervous about those excess processes that Chrome spawns, not to worry, it looks like they're there only to help enhance your web browsing experience.

At least, that's what Skynet wants us to think.  

Sunday, January 8, 2012

Excel Page Breaks in SQL Server Reporting Services 2008 by Number of Rows and Preserving Column Headers

In your adventures or misadventures with SQL Server Reporting Services 2008 (SSRS), you may be asked to produce exceptionally large tabular reports to be exported to Excel either interactively or on a subscription.  While one would assume this to be a non-issue with SSRS, we then realize that SSRS 2008 unfortunately still exports to an Excel 2003 format, and thus is at the mercy of the dreaded 65536 rows per sheet limitation.


In other words, if you produce a simple tabular report that outputs, say, 100,000 rows of data, and want to export it to Excel, you will get a pretty nasty message from SSRS resembling an unhandled ASP .Net exception, which informs you that Excel sheets (at least in the 2003 version) have a 65536 row limitation.  Drat!


While the solution would be to have SSRS just export to Excel 2007 or 2010 formats and dump the results to one sheet like a proper modern application, Microsoft felt the need to still tightly couple the output to the "lowest common denominator" of Excel 2003, which, to this day, is probably still the most widely used version of Excel (and MS Office).


So, that kind of leaves us developers out on an island initially.  Of course, the next best option is to have SSRS create Page Breaks every 65536 rows, but how are we supposed to do that?  Furthermore, how do we have the column headers for the tabular report repeat on each page?  Through some digging in various forums and MSDN, the solution to this little conundrum is documented below.


  • Database Source: AdventureWorks2008 Database
  • Database Table: HumanResources.Employees
  • Objectives:
    • Produce an Excel output from SSRS 2008 which produces a new sheet every 100 rows
    • Ensure that the column headers repeat on the new pages
    • Freeze the column headers when browsing the report directly on the web browser
So, let's get started by creating a new report which will point to the HumanResources.Employees table of the AdventureWorks2008 database, and throw all of the data elements to the Details section of the report.
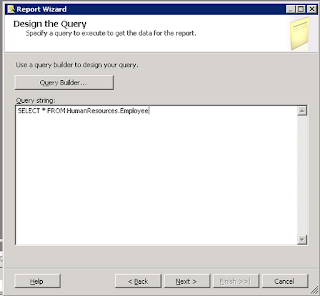

Step 1: Standard SQL query to obtain data

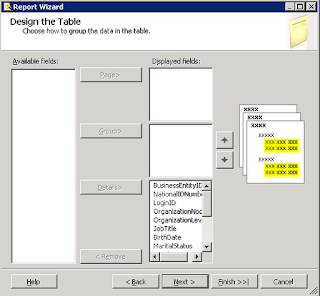
Step 2: Move columns to the Details
Step 3: Easy peasy lemon squeezy

Page Breaks Every Specified Number of Rows

So, now we have our standard tabular report.  Let's fulfill our first objective, having a new sheet produced every 100 rows.  This is accomplished by creating a new parent group to the details and specifying a Group Expression for this new parent group.

Step 1: Meet the Parent
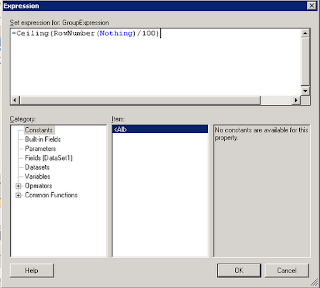
Step 2: Use the following syntax to group your details by number of rows --
=Ceiling(RowNumber(Nothing)/[number of rows]).  
Example above breaks the groups up by 100 rows.
Hit OK twice and you will notice a new group (called Group1) created as the parent of your details.  We need to further modify this group to create our Page Breaks, so go ahead and double click on that newly created parent group to bring up the Group Properties window.  We will now instruct this report definition to break at the end of the group, as well as remove unnecessary sorting on the group and the new "Group1" column created on our report design.

Step 3: Enable page breaks
Step 4: Click on the "Sort by" and then click the Delete button.  Press OK twice to save Group Properties.

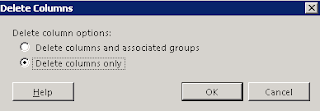
Step 5: Delete the new "Group1" column that's been thrown onto the design.  Delete the columns ONLY.

So, now we have a report definition that page breaks every 100 rows.  Brilliant!  We're done, right?  Well, not necessarily.  Suppose our client wants to see the column headers on each new page, as well as have the column headers freeze themselves when they browse the report on their browser interactively...


Repeating Column Headers in Excel and Freezing Interactive Column Headers


The first thing we need to do is to go into Advanced Mode for our Row Groups.  This is accomplished by clicking the small black down arrow to the far right of the "Column Groups" label.
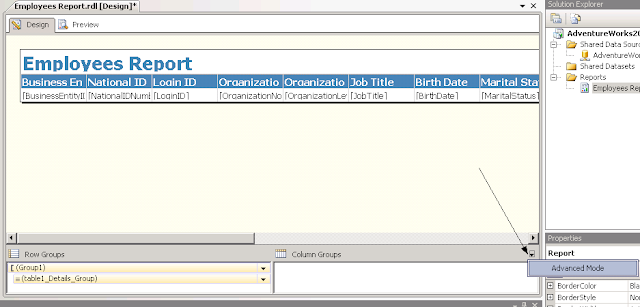

Step 1: Click on Advanced Mode
Now that we've got Advanced Mode up, click on the first item on the Row Groups labelled "(Static)" and bring up the Properties window if it's not already on your toolbox.


Step 2: Set FixedData to True (freezes column headings in interactive mode), then set KeepsTogether and RepeatOnNewPage to True and KeepWithGroup to After (publishes column heading on each page when output to Excel).
Congratulations, you have now created an SSRS tabular report that breaks every 100 rows and reproduces the column header on each new sheet, as well as freezes the column headers when scrolling down interactively!


In Summary...


Do I wish that there was more apparent solution to this seemingly trivial issue?  I absolutely do.  I'm not sure why this design limitation was overlooked in the development process of SSRS 2008.  It would seem to me that the proper solution would be that the SSRS Excel output algorithm would be loosely coupled from SSRS itself and be dependent upon the version of Excel one installs on the server on which SSRS is running?


Anyway, whatever the reason, at least there is a solution out there, albeit a bit of a roundabout one.