In your adventures or misadventures with SQL Server Reporting Services 2008 (SSRS), you may be asked to produce exceptionally large tabular reports to be exported to Excel either interactively or on a subscription. While one would assume this to be a non-issue with SSRS, we then realize that SSRS 2008 unfortunately still exports to an Excel 2003 format, and thus is at the mercy of the dreaded 65536 rows per sheet limitation.
In other words, if you produce a simple tabular report that outputs, say, 100,000 rows of data, and want to export it to Excel, you will get a pretty nasty message from SSRS resembling an unhandled ASP .Net exception, which informs you that Excel sheets (at least in the 2003 version) have a 65536 row limitation. Drat!
While the solution would be to have SSRS just export to Excel 2007 or 2010 formats and dump the results to one sheet like a proper modern application, Microsoft felt the need to still tightly couple the output to the "lowest common denominator" of Excel 2003, which, to this day, is probably still the most widely used version of Excel (and MS Office).
So, that kind of leaves us developers out on an island initially. Of course, the next best option is to have SSRS create Page Breaks every 65536 rows, but how are we supposed to do that? Furthermore, how do we have the column headers for the tabular report repeat on each page? Through some digging in various forums and MSDN, the solution to this little conundrum is documented below.
- Database Source: AdventureWorks2008 Database
- Database Table: HumanResources.Employees
- Objectives:
- Produce an Excel output from SSRS 2008 which produces a new sheet every 100 rows
- Ensure that the column headers repeat on the new pages
- Freeze the column headers when browsing the report directly on the web browser
So, let's get started by creating a new report which will point to the HumanResources.Employees table of the AdventureWorks2008 database, and throw all of the data elements to the Details section of the report.
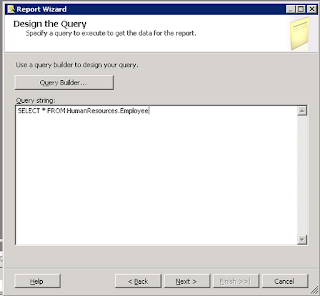 |
| Step 1: Standard SQL query to obtain data |
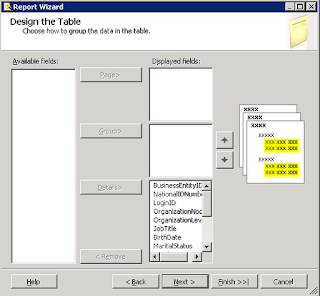 |
| Step 2: Move columns to the Details |
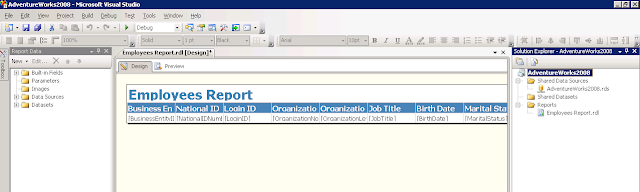 |
| Step 3: Easy peasy lemon squeezy |
Page Breaks Every Specified Number of Rows
So, now we have our standard tabular report. Let's fulfill our first objective, having a new sheet produced every 100 rows. This is accomplished by creating a new parent group to the details and specifying a Group Expression for this new parent group.
 |
| Step 1: Meet the Parent |
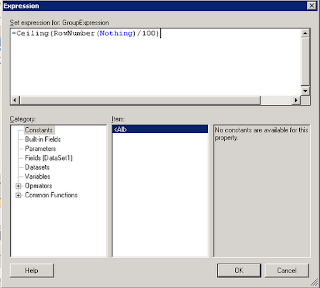 |
Step 2: Use the following syntax to group your details by number of rows --
=Ceiling(RowNumber(Nothing)/[number of rows]). Example above breaks the groups up by 100 rows. |
Hit OK twice and you will notice a new group (called Group1) created as the parent of your details. We need to further modify this group to create our Page Breaks, so go ahead and double click on that newly created parent group to bring up the Group Properties window. We will now instruct this report definition to break at the end of the group, as well as remove unnecessary sorting on the group and the new "Group1" column created on our report design.
 |
| Step 3: Enable page breaks |
 |
| Step 4: Click on the "Sort by" and then click the Delete button. Press OK twice to save Group Properties. |
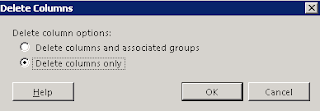 |
| Step 5: Delete the new "Group1" column that's been thrown onto the design. Delete the columns ONLY. |
So, now we have a report definition that page breaks every 100 rows. Brilliant! We're done, right? Well, not necessarily. Suppose our client wants to see the column headers on each new page, as well as have the column headers freeze themselves when they browse the report on their browser interactively...
Repeating Column Headers in Excel and Freezing Interactive Column Headers
The first thing we need to do is to go into Advanced Mode for our Row Groups. This is accomplished by clicking the small black down arrow to the far right of the "Column Groups" label.
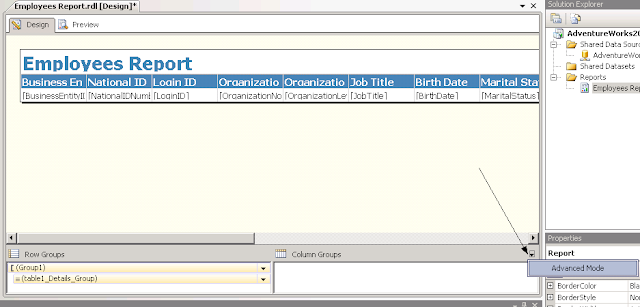 |
| Step 1: Click on Advanced Mode |
Now that we've got Advanced Mode up, click on the first item on the Row Groups labelled "(Static)" and bring up the Properties window if it's not already on your toolbox.
 |
| Step 2: Set FixedData to True (freezes column headings in interactive mode), then set KeepsTogether and RepeatOnNewPage to True and KeepWithGroup to After (publishes column heading on each page when output to Excel). |
Congratulations, you have now created an SSRS tabular report that breaks every 100 rows and reproduces the column header on each new sheet, as well as freezes the column headers when scrolling down interactively!
In Summary...
Do I wish that there was more apparent solution to this seemingly trivial issue? I absolutely do. I'm not sure why this design limitation was overlooked in the development process of SSRS 2008. It would seem to me that the proper solution would be that the SSRS Excel output algorithm would be loosely coupled from SSRS itself and be dependent upon the version of Excel one installs on the server on which SSRS is running?
Anyway, whatever the reason, at least there is a solution out there, albeit a bit of a roundabout one.


1 comment:
Thank you so much, this had been driving me nuts all morning!
Post a Comment